Flow Clotometry vs Microscopy: How Labs Actually Count Microclots
English Narration
At-Home Blood Spot • 6K Video Microscopy • $160
Short answer
Flow clotometry and fluorescence microscopy evaluate microclots through fundamentally different physical mechanisms. Flow clotometry suspends plasma through hydrodynamic fluidics, counting fluorescent events as particles pass lasers at high speed. Video microscopy captures intact, stationary fibrin matrices across 6K RAW multi-plane fields. Because fluid shear forces in flow cytometers can fragment delicate aggregates, numerical scores across the two platforms are not directly interchangeable.
Key takeaways
- 1Flow clotometry provides high-throughput particle counts by streaming suspended plasma past optical sensors.
- 2Fluorescence video microscopy visualizes intact fibrin architecture, cross-beta sheet density, and platelet adhesion.
- 3Hydrodynamic shear stress inside cytometer flow cells can break fragile microclots into smaller fragments.
- 4Automated cytometer event gates often conflate large platelet clumps with dense amyloid fibrin sheets.
- 5Results between flow clotometry counts and microscopy staging grades cannot be converted mathematically.
As research into anomalous blood clotting has expanded, clinicians and investigative patients increasingly encounter two competing laboratory terms: fluorescence microscopy and flow clotometry (imaging flow cytometry).
Both methodologies use the same underlying fluorophore chemistry (Thioflavin T) to detect cross-beta amyloid structures in blood. However, they rely on entirely different physical principles to detect, quantify, and report microclots.
Understanding the mechanics of both systems is crucial for interpreting clinical literature, comparing testing providers, and avoiding confusion when reviewing different report formats.
The Physical Mechanisms: Stationary Optics vs Hydrodynamic Flow
The fundamental distinction between microscopy and flow clotometry comes down to whether the specimen remains stationary or flows under pressure.
Fluorescence Microscopy: Native Structural Geometry
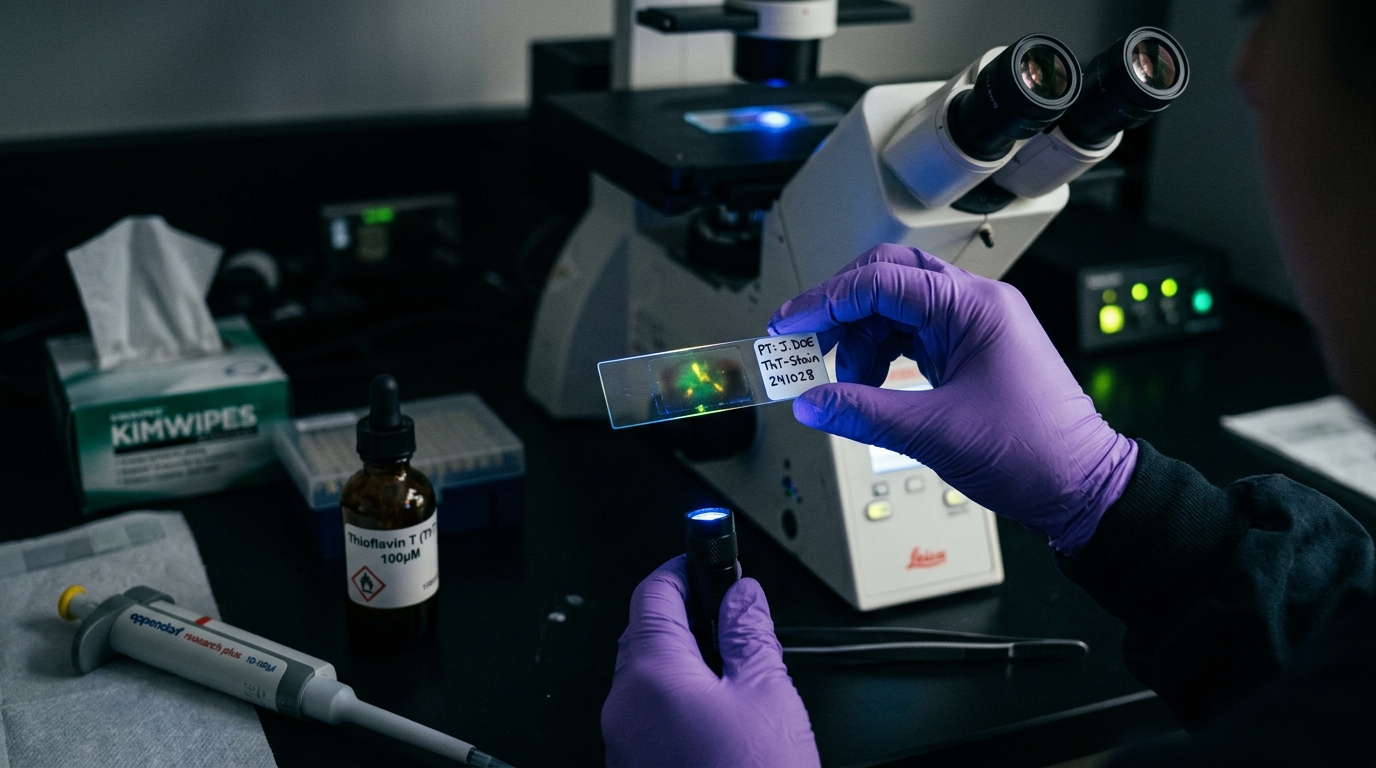
In standard fluorescence microscopy, a biological sample is mounted onto a glass slide, covered with a cover slip, and placed on a fixed mechanical stage. As detailed in our guide to the amyloid fibrin test, the specimen is illuminated with ultraviolet excitation light (485 nm), causing bound Thioflavin T to emit green fluorescence.
Because the specimen remains completely stationary, the microscopist can examine the native, undisturbed architecture of the clot:
- Fibrin strand branching and interconnected mesh density
- Entrapped red blood cell ghosts and cellular debris
- Adherent platelet syncytia interacting with the amyloid perimeter
- Multi-plane z-stack depth and spatial orientation
Flow Clotometry: High-Throughput Hydrodynamic Fluidics
Flow clotometry adapts clinical flow cytometry for non-cellular particle counting. Liquid plasma stained with fluorophores is injected into a sheath fluid stream inside a flow cell.
Hydrodynamic focusing forces the fluid into a narrow core, aligning suspended particles into a single-file stream. As particles transit through the interrogating laser beam at velocities of several meters per second, photodetectors measure forward scatter (size), side scatter (internal complexity), and fluorescence emission intensity.
In imaging flow cytometry (such as ImageStream platforms), a high-speed CCD camera captures brief, microsecond digital snapshots of every particle as it transits the beam.
This produces immense statistical data: an instrument can analyze 50,000 individual events in under two minutes, generating precise event counts per microliter.
The Technical Trade-Offs: Hydrodynamic Shear vs Reader Variability
Neither technology is without limitations. Both present distinct engineering and biophysical compromises.
The Problem with Flow Clotometry: Hydrodynamic Shear and Gating
The primary vulnerability of flow clotometry is physical fluid dynamics. To achieve single-file alignment, plasma is accelerated through high-pressure microchannels.
This process introduces substantial hydrodynamic shear stress. Anomalous amyloid microclots vary widely in tensile strength:
- Shear Fragmentation: Delicate Phenotype 1 and 2 microclots can be torn apart by shear forces inside the nozzle, transforming a single 30-micrometer aggregate into twenty 2-micrometer fragments and artificially inflating event counts.
- Channel Clogging: Massive Stage 4 confluent mats exceeding 60 micrometers cannot pass through narrow fluidic apertures, risking instrument clogging or being excluded by physical pre-filters.
- Arbitrary Gating: Flow cytometrists must draw software boundaries ("gates") to differentiate true amyloid microclots from unlysed platelets, chylomicrons, and dye aggregates. Setting threshold gates too low captures optical noise, while setting them too high misses clinically relevant smaller microclots.
The Problem with Microscopy: Field Selection and Reader Subjectivity
The historical weakness of manual fluorescence microscopy in academic research has been subjective field selection:
- Observer Bias: A human operator manually adjusting the microscope stage may unconsciously select fields with prominent glowing clots while bypassing emptier fields.
- Qualitative Scoring: Assigning numerical stages (Stage 1 through 4) based on human visual impression introduces inter-observer variability between different testing laboratories.
Modern automated microscopy platforms resolve this problem by recording unedited 6K RAW video sweeps across standardized, randomized slide coordinates, coupled with computer-vision fibril area measurements.
Side-by-Side Comparison: Flow Clotometry vs 6K Video Microscopy
The following breakdown illustrates how testing parameters compare between flow-based counting and video microscopy:
| Evaluation Parameter | Flow Clotometry (Imaging Flow Cytometry) | 6K RAW Video Fluorescence Microscopy |
|---|---|---|
| Physical Specimen State | Liquid plasma moving under hydrodynamic flow | Stationary dried blood spot rehydrated on glass |
| Primary Metric | Statistical particle count per microliter | Visual morphological stage & percentage area |
| Structural Integrity | Exposed to high fluid shear stress | Undisturbed native fibrin geometry |
| Large Aggregate Handling | Excluded or sheared by narrow microchannels | Directly visualized regardless of size (>50 µm) |
| Visual Evidence | Thumbnail crops of moving particles | High-definition 6K video sweeps across fields |
| Availability | Academic core facilities & research centers | Mail-in laboratory kits ($160 USD) |
| Clinical Utility | Quantitative data for clinical trials | Visual confirmation for physician consultation |
To review where these tests are offered commercially, see our directory of microclot testing labs and treatment centers.
Why Results Are Not Directly Interchangeable
Patients who undergo testing at multiple facilities often attempt to compare their flow cytometry numbers against microscopy staging reports.
Doing so is a mistake. A flow clotometry report stating "12,400 microclot events per microliter" cannot be converted into a "Stage 3" microscopy result through any mathematical formula.
The two methods differ in sample preparation, dilution ratios, and optical detection physics:
- Flow cytometry counts discrete optical pulses above an instrument voltage baseline.
- Microscopy evaluates the cumulative percentage of slide surface area covered by insoluble cross-beta sheets.
When tracking changes over time, whether evaluating lifestyle adjustments or clinician-supervised protocols, always use the same methodology and laboratory platform for follow-up testing.
Context Within the Broader Category of Amyloid Testing
Before scheduling either test, ensure that microclot evaluation matches your specific clinical questions. As detailed in our comprehensive guide to types of amyloid tests, the word amyloid describes a conformational protein state rather than a single organ disease.
Neither flow clotometry nor fluorescence microscopy evaluates:
- Brain Amyloid-Beta: These assays do not measure plasma p-tau or evaluate cerebral plaques for Alzheimer's dementia.
- Systemic Amyloidosis: These tests do not replace biopsies or pyrophosphate scintigraphy for AL or ATTR amyloidosis.
- Acute Thrombosis: They do not replace D-dimer or Doppler ultrasound for deep vein thrombosis or pulmonary embolism.
The At-Home 6K Video Microscopy Workflow
To make research-grade fluorescence microscopy accessible without requiring visits to specialized university hospitals, at-home collection kits were developed.
Our at-home microclot test uses dried capillary blood collection. Patients collect a finger-prick blood spot, allow it to dry on a collection card, and mail it to our dedicated partner laboratory in Mexico City.
Dried blood collection prevents the spontaneous platelet activation and enzymatic degradation that occurs when liquid plasma tubes sit in transit.
At the laboratory, the specimen is prepared with calibrated Thioflavin T staining and recorded on 6K 12-bit RAW video under a 20x optical objective. The resulting Videographic Microscopy Report gives patients and their treating physicians undeniable visual proof of microvascular status for $160 USD (3,200 MXN).
Frequently asked questions
What is flow clotometry?
Flow clotometry is an application of imaging flow cytometry designed to quantify microclots. Platelet-poor plasma is stained with fluorophores like Thioflavin T and pumped through a microscopic fluidic channel, where a camera and laser array capture images of thousands of individual flowing particles per minute.
Why do researchers disagree on whether flow cytometry or microscopy is better?
Microscopy was the original technique used to discover microclots, offering direct visual observation of native morphology, but manual visual grading can suffer from subjective reader bias. Flow cytometry offers objective, high-throughput statistical counts, but high fluidic shear stress can alter clot structure and instrument gating requires complex calibration.
Can a flow cytometry microclot count be converted to a microscopy stage?
No. A microscopy report grades visual clot surface area and structural density across stationary fields of view (Stages 1 through 4). Flow cytometry counts individual particle events above a specific fluorescence threshold per microliter. Because preparation methods and sample dilutions differ, the numerical values are not directly comparable.
Which method does the at-home amyloid test kit use?
Our at-home test uses 6K 12-bit RAW video fluorescence microscopy at 20x optical magnification. Dried capillary blood samples are rehydrated, stained with calibrated Thioflavin T, and imaged under narrow-band ultraviolet excitation, providing full video sweeps to patients and clinicians.
Sources
- A central role for amyloid fibrin microclots in long COVID/PASC: origins and therapeutic implications. Biochemical Journal, 2022
- Persistent clotting protein pathology in Long COVID/Post-Acute Sequelae of COVID-19 (PASC) is accompanied by increased levels of antiplasmin. Cardiovascular Diabetology, 2021
- Detection and quantification of fibrinaloid microclots in health and disease using imaging flow cytometry. Heliyon, 2023
At-Home Amyloid Test
Inspect your microvascular health with 6K video microscopy
Order an at-home blood test kit for $160 USD. Receive 6K RAW video fluorescence microscopy and an objective laboratory report.
Next steps
- Amyloid Fibrin Test: How Fibrin Amyloid Microclots Are DetectedWhat an amyloid fibrin test is, how Thioflavin T microscopy spots fibrin amyloid microclots, how it differs from D-dimer, and what it can't tell you.
- Amyloid Fibril Test: Methods Used to Detect Amyloid FibrilsHow an amyloid fibril test works: Thioflavin T, Congo red, electron microscopy, X-ray diffraction and seeding assays compared, with which are clinical.
- Types of Amyloid Tests: Blood Tests, PET, CSF, Biopsy and MicroclotsCompare the types of amyloid tests: Alzheimer's blood tests, amyloid PET, spinal fluid, amyloidosis biopsy and fibrin amyloid microclot microscopy.

Tim Ottowitz
Founder & Research Lead
Tim Ottowitz founded Amyloid Test and writes its Science Hub, turning fibrin amyloid and spike protein research into plain-language guides that stay close to the published evidence.
Keep reading
At-Home Microclot Test vs Clinic: Cost, Labs, and Accuracy
Compare at-home microclot tests with in-person clinic testing. Examine cost, wait times, sample stability, and 6K ThT fluorescence microscopy methods.
Positive Amyloid Test: What Results Mean and Doctor Questions
Received a positive amyloid test? Learn what ThT fluorescence microscopy detects, how microclot stages work, and specific questions to ask your doctor.
D-Dimer vs Microclot Test: Why a Normal D-Dimer Can Miss Microclots
D-dimer vs microclot test compared: what each measures, why D-dimer can read normal in Long COVID, and how Thioflavin T microscopy finds fibrin amyloid.